Reblogged this on Raja Oktovin's Blog and commented:
This blog post is definitely a good exposition of why statistics, when understood only as function & numbers, are not reliable.
As a visual learner (and not really any other type of learner) I appreciate the colorful breakdown! If you could re-teach me everything I’ve forgotten about statistics that would be awesome, thanks.
Reblogged this on Statistics and Substance use and commented:
Wonderfully simple depiction of why you should take a lot of statistics with a pinch of salt. You need to look deeper and explore the underlying distribution.
Goes with “Figures don’t lie, but liars can figure.”
Outlaw MJ because 90% of heroin addicts started with MJ.
Which begs the question “Why not outlaw milk, because I’m pretty sure 99% of heroin addicts started with milk.”
The median is the point where half the data is above it, and half the data is below it. So in this case, there are 6 data points (way) below 0 and 7 data points (slightly) above 0. The smallest of the positive data points is the median, since 6 points would be above it, and 6 points would be below it.
If there were an even number of points, the convention is to use the midpoint between the two closest numbers. (So if you had 6 points above and 6 points below, you’d take the average of the lowest number above 0 and the highest number below 0).
Great post – learning statistics has been extremely useful in deciphering how so many true statistical statements completely hide the truth.
Median values is not only the “middle” one in the set. The set itself has to be arranged from lowest to highest values. So yeas, the pic for the median is wrong.
It’s in chronological order instead of in order of lowest value to highest, which is how you’d expect the gains from a mutual fund to be charted.
@BlackBloc If the list is in chronological order, then only median value you could get would be the median date, not the median gain.
The picture isn’t wrong, but the statement doesn’t appear to be correct. The median value, once the values are arranged in order from lowest to highest, looks like a 10% gain; not 8%. The 8th data point (not rearranged) along the x-axis is the value associated with the median value in this data array; and it looks like it exceeds 10%. Long story short, the wrong answer is given in the illustration.
Statistics (and “fellow staticians” (sp)) don’t lie; but ignorant consumers of statistical information can easily have the wool pulled over their eyes.
Yes, that is true as happens in Kenya, where politicians use the same data and analytical methods but come up with different outcomes hence damned lies.
I worry that a headline like “Why Not to Trust Statistics” coupled with a “statistical liar” avatar in each illustration panel may unfairly encourage the reading of the message as “Why Not to Trust Statisticians”—who are in theory (pun intended) exactly the scientific professionals best trained to identify the sorts of untrustworthy statistics that motivate the headline. I would probably have had a concluding panel with an avatar helpfully suggesting, “Ask a statistician!”, so readers would know where to go. But otherwise, this post does a nicely intuitive job of (literally) illustrating why and how to be careful of reported statistics.
So agree with this! Increasingly pissed off with the “lies, damned lies, and statistics” line. Easy line for students that don’t like stats to motivate why they don’t need to like stats.
I am disappointed by your title since you are spreading a distrust of a method of reasoning and not the interpretation itself. You should be teaching that statistics is the collection of data points for interpretation and not proof of some concept or idea. The mean, the mode, and the median are descriptions of the collection of data points and nothing more. How often do individuals and groups use averages as proof of some theory or idea and yet very few people actually challenge the “numbers” as descriptions of the data and conclusive proof of anything. The funny thing is that statistics don’t lie, people do. Yet to continue sowing mistrust of numbers rather that exposing misinterpretations is an outrage. Even regression is a method of inference since we are examining how well the data points regress or come close to the mean. A collection of data points is meaningless until we seek to infer a pattern through analysis. This is what you should be teaching your students. And that to infer is not to prove an absolute. We seek to infer from a population what particular data points of a particular behavior have a general pattern, not that all data point behaviors are exactly the same. If all data points were exactly the same then we would need no analysis. But in real life, we never have such a luxury. We must use inference instead.
This would be better titled “why you should learn basic statistics.”
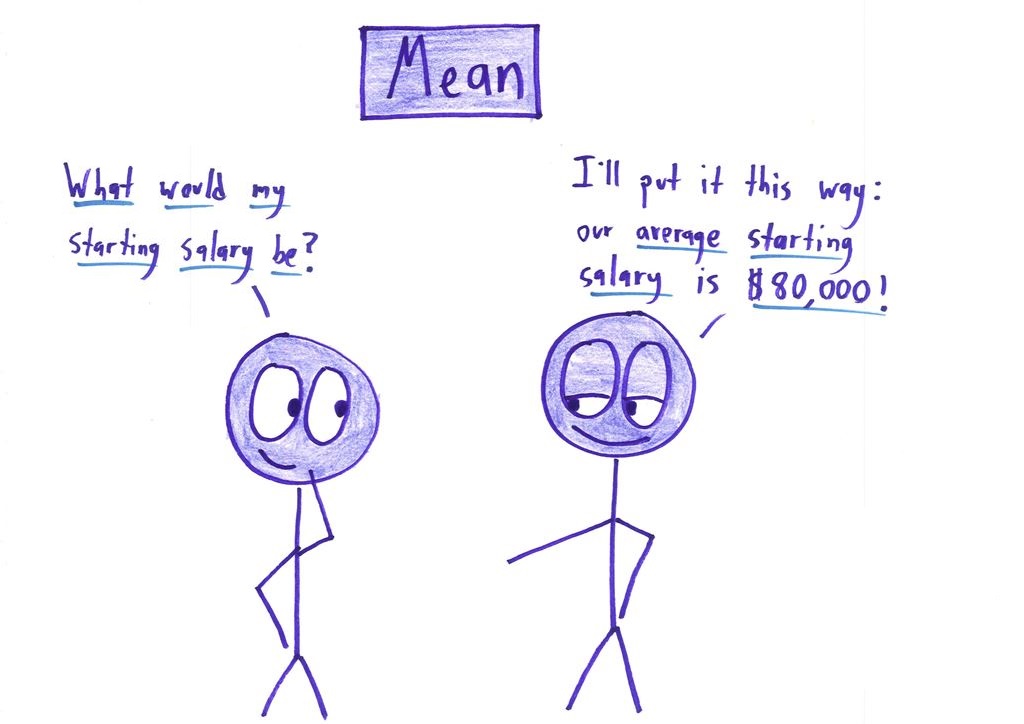
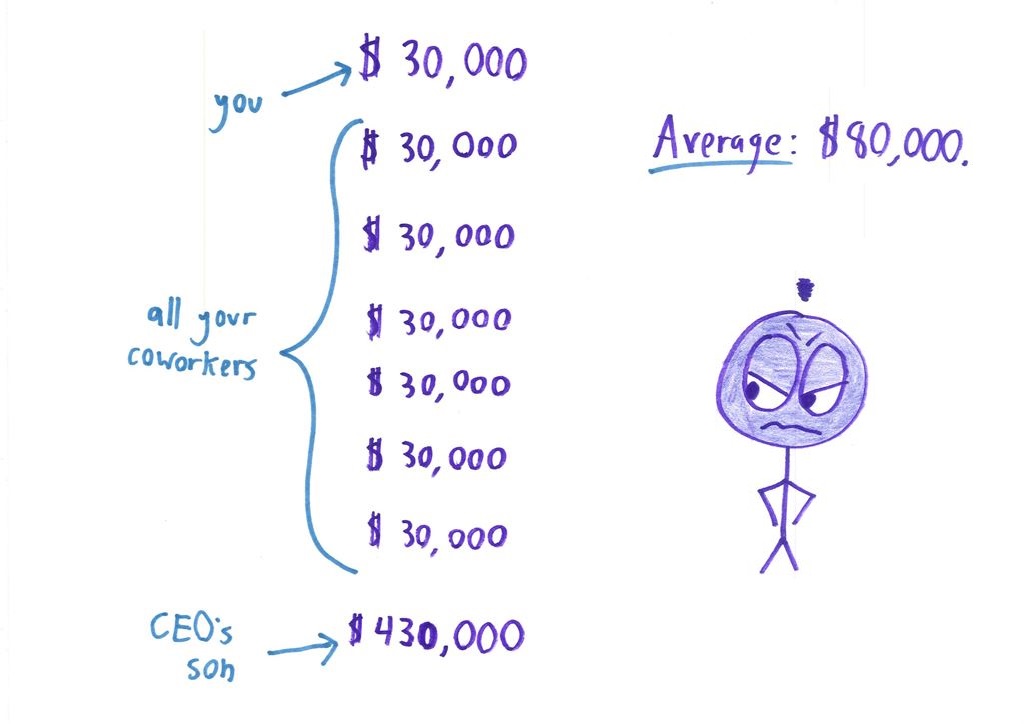
Statistics don’t lie, statistics are numbers and numbers never lie. PEOPLE are the ones who lie. And those people can only lie when their audience doesn’t know heads or tails about this stuff. With a basic knowledge of statistics, when someone says “the average for the whole company is $30,000” you’ll be smart enough to say “and how does that compare to the company wide median?” When someone says “my median is 8% gains” you’ll be smart enough to go “and what’s the average?”
Of course there are other important questions you’ll learn to ask as well: “How large is the sample size?” “How was the sample taken?” “What purposeful or accidental biases exist in the sampling process?”
I hate it when people say “statistics lie” because it’s patently false; *statisticians* with agendas lie. Hard statistics, properly measured, are the only way we can figure out a lot of cultural trends: is there a wage gap? Are police more violent towards black people? Is the US infrastructure starting to fail? Does human-caused global warming exist? Is this drug causing negative side effects? Is this drug more useful than a placebo? Do vaccines cause autism?
We need statistics and the public can’t go around thinking “statistics lie.” The public needs a better understanding than that. They need to be thinking “statistics can be manipulated by those with agendas, is the statistic I’m looking at now one such statistic?”
The more you know, the harder it is to lie to you about things. Remember that. You can’t dismiss a statistic out of hand because “I read statistics lie,” but neither can you immediately accept it because statistics can be manipulated. Statistics is a rock solid branch of mathematics and, if executed in an unbiased manner, it will always give you a correct answer inside whatever error bounds you choose.
I’d only add that “statisticians” here refers to a larger group of people than just “professional statisticians”. I’m a biostatistician, for example, and there are professionals like me called statisticians; both of us are trained in statistics, and are professional statisticians. On the other hand, many other professionals who use statistics (e.g., in business, finance, economics, sociology, psychology, medicine, computer science, data science) haven’t necessarily been trained with as much rigor as we have in statistical principles. Hence, they aren’t professional statisticians, but rather professionals who use statistics. And then, there are non-professionals who are even less trained in statistics, who nonetheless will use them.
So I’d say that “*statisticians* with agendas lie” really means “*people who use statistics* make mistakes, and having an agenda can even encourage such people to lie using statistics.”
I’ll emphasize that many non-statistician professionals may certainly qualify as professional statisticians over time, and may eventually surpass an average professional statistician in her/his knowledge of statistical principles. A non-statistician professional may even start out more qualified in statistical principles than an average professional statistician; there are definitely many that have.
My point is that in general, a professional statistician has had more training in statistical principles compared to a non-statistician professional, and so in theory is best-poised for consultation about possible statistical deception. Of course, that also means professional statisticians in general have the added responsibility to call out misleading statistical reporting done by people who report statistics (e.g., see list above), and an added responsibility to improve statistical education and literacy.
Sure, I’ll happily agree with that. We can say that “statisticians” refers to a larger set of people. A lot of times the people aren’t statisticians or even “professionals who use statistics”, as you say, they are just reporters or pundits or politicians with an agenda. They will pick a single number out of a larger study and spit it back out because it “supports” their narrative, even though it really is a worthless number. And yes, I’ll agree that sometimes it is just purely a mistake which results in statistics being misrepresented; but I feel like more often then not in the daily life of “average people” who don’t work with numbers all day most of the statistics they see are not “by accident.” They are set out there with a goal in mind; see Fox News and/or MSNBC. the two far sides of the coin.
Take the 27cent wage gap stat, for instance, which is grossly misrepresented on a regular basis in the media. It was taken a straight average income of all men vs the average income of all women. It didn’t account for profession, level of education, or hours worked even. That number was cherry-picked out of the census report and repeated by less well educated women’s rights groups as a “bias in the workplace against women.” It doesn’t, of course, show that. It just shows women on average aren’t paid as much. Maybe because they only work part time more frequently, maybe because they choose different and lower paying careers, maybe because they have fewer years in the workplace because they had kids first, maybe because etc. etc. The point being the 27cent figure didn’t demonstrate anything about WHY a gap exists, just that it did, and the people claiming it was all sexism were [idiots] drawing conclusions which were not supported by the data. Of course, you probably know this, being a statistician yourself, it’s more for others who might read this to consider.
(Before someone jumps down my throat, I’m not claiming there is no sexism. I think there is a lot of sexist practices both towards men and women in our current culture; I’m just claiming the 27 cents figure is incorrect; most studies put it at less than 2 cents which is within the margin of error for those studies so they can’t even claim one exists).
I think there’s an analogy to be made with a number of other mathematical ideas–like No Free Lunch, Halting, Kolmogorov Compexity–that often have some essence of “there’s no one true method/algorithm, there are always perverse inputs”. Which doesn’t mean that we treat things like optimization, computability, and compression as untrustworthy, just that everything has their limit.
So too with data, no one parameter to rule them all (and in the darkness, bind them). Which I see you agree with in your comment.
But, what about two numbers? If you paired each location example (mean/median/mode) with a scale parameter (stdev, MAD) and vice versa, it would strike me we’d be able to catch the lie in most of the examples. Could you easily provide examples where a median and IQR leads to a big lie?
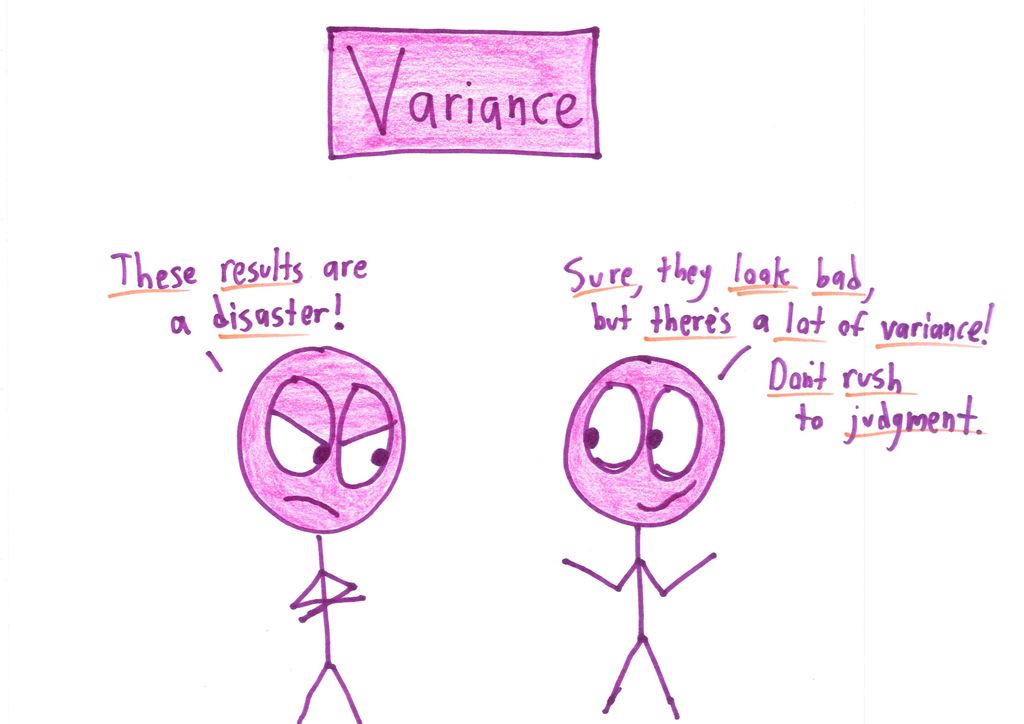
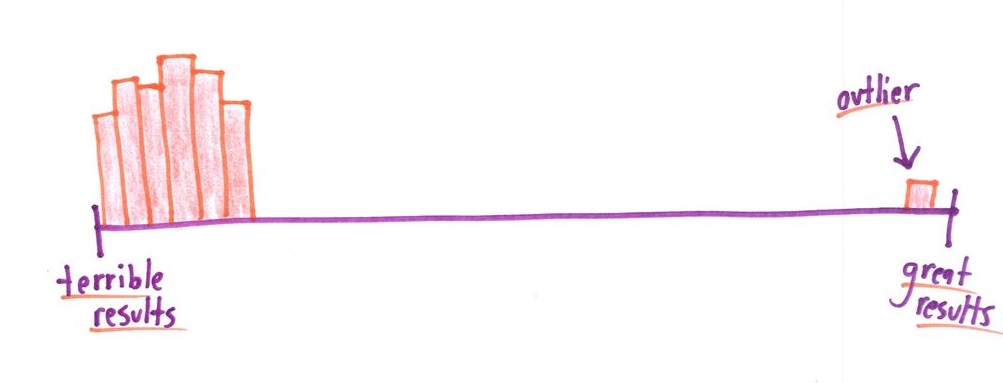
The median, correlation coefficient, and variance pictures are incorrect/not realistic. To find the median of a dataset: the median is arranged in increasing order, and then you find the middle value or average of the 2 middle values (if there is an even number of data). And as for the correlation coefficient and variance, the outliers would be removed if they’re outliers that will ruin the normality of the dataset.
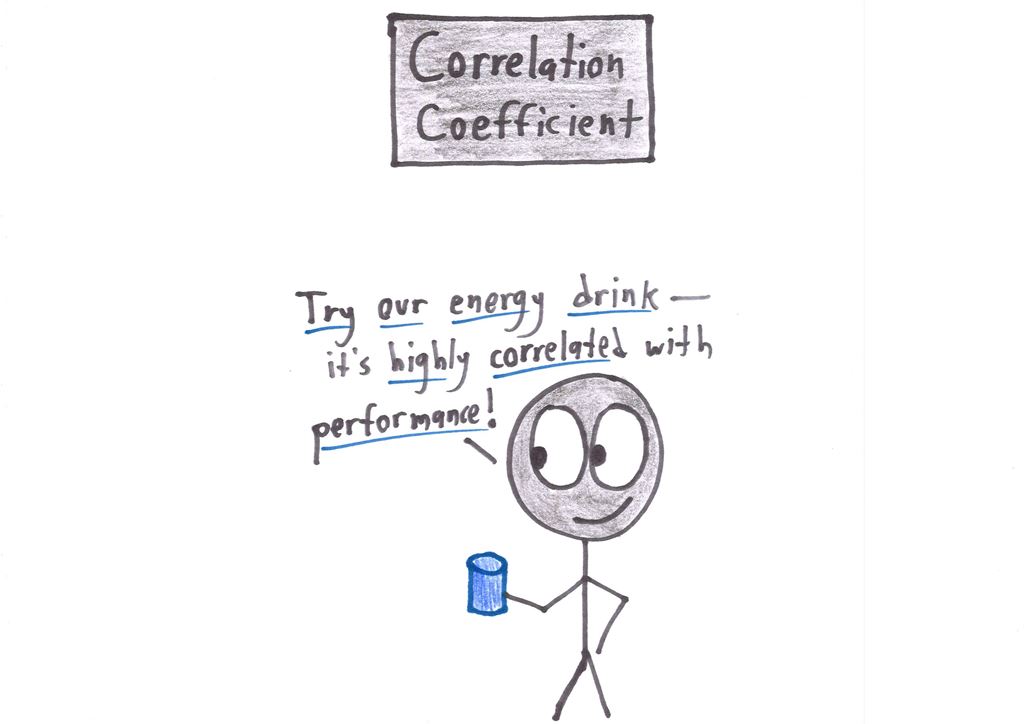
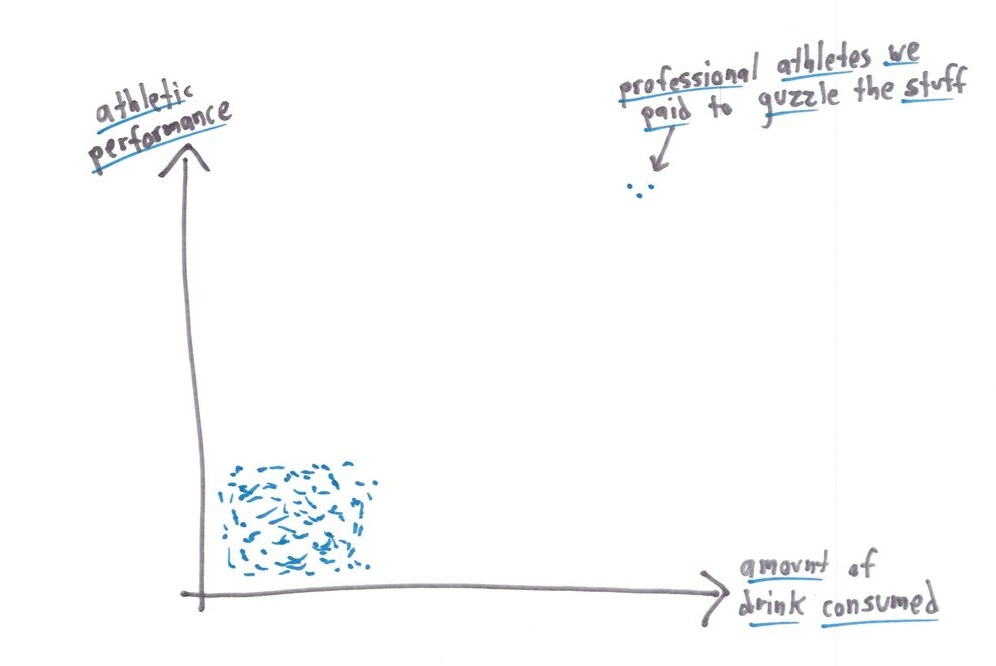
In addition, for the correlation coefficient experiment, the “professional athletes that they paid to guzzle the drink” would result in a pretty strong bias, which would be a red flag in the experimental design. The design of the experiment is the difference between your numbers being meaningless and not really representative of the population, or actually holding some kind of value (given that variables are controlled for). For example, you’d want your subjects to have similar activity levels, degrees of physical fitness, overall health and such, or else you’re just wasting time and money. I understand that you’re trying to make people more aware of bullshit and to think critically, but I think that this could give people the idea that the whole point of statistics is to put melted nutella on a rolled up horse turd and trick someone into eating it. It really isn’t. What we need is to teach statistical literacy, not to demonize the whole discipline.
@Greg, capital technical points, which I think emphasises the Meaning of the toons; Understanding patterns of data presents opportunities to engage with the material in the post. I think it has great pull value.
@Char, I know I’m very late to reply, but it does have a great pull value (which is why I commented on this haha), but I just think that the message is counterproductive. But in order to understand and engage the material in this post, you need to have a working knowledge of the very basic fundamentals of statistics first.
That’s how the fundamentals can be learnt. By asking the question, ‘How Is This An Issue?’ the reader engages. Assuming they follow-thru on their curiosity the wrestle begins; the game is afoot! Curiosity, reasoning, play….nNow the fundamentals have relevance and are not simply being ‘memorised’.
To paraphrase Mark Twain:
“There are lies, damned lies, and … statistics”
(The following is taken almost verbatim from my related Facebook post.)
I definitely share your desire that people think more critically. However, as a professional statistician (specifically, a biostatistician), I’ve started taking issue with that particular well-worn platitude, because I think it overreaches by casting most or all of statistics as lies—and therefore, by cognitive ease, most or all people who report statistics as liars. And despite the fact that many non-statistician professionals report statistics (e.g., in business, finance, economics, sociology, psychology, medicine, computer science, data science, biology, physics, math), my profession may receive most of the ire at misleading statistics because the word “statistics” is explicitly in our profession’s name—and is the core of all of our training. Also, the advancement of science rests on good statistical practice, and has benefited from “statistics” which, writ large, I sure hope aren’t either lies or damned lies.
To me, the statement tacitly reads, “Lies, Damned Lies, and Statistics (reported by all Statisticians)”. This may be like saying, “Wrongs, Injustices, and Laws (created by all Lawyers), or “Placebos, Quackery, and Drugs (given by all Doctors)”. (I may, however, accept, “Lies, Damned Lies, and Misleading Statistics”.)
But again, I agree with and strongly support the sentiment that reported statistics should be treated warily—not only when you are skeptical, but especially when you find yourself agreeing with them. That is, after all, good scientific practice. =)
I would, however, agree that the sentiment behind “Lies, Damned Lies, and Statistics” makes sense conditional on what I believe you’re expressing; i.e., “I don’t trust you, so I think pretty much anything you tell me will be a lie—including any statistics you show me.” That makes sense to me. I only hope, as you do, that people think critically enough about this statement to realize that it may not apply if you actually trust the person reporting the statistics.
mmm… the first sample is good… the avg salary is correct, the interpretation is good too.
the problem is choosing the more relevant statistics. and this statistics is related to what’s you want to see. you’ll always select the statistics which promote your idea and always find a reason to hide some other stats or data.
we can only trust raw data (with the limit of the data quality issues) everything else involves a human and “personnal” objectives, causing the issues.
I’ll caution, however, that even raw data are collected by people; i.e., even if data collection is automated, the data-collection design and protocol was designed by people. So for me, interpretation permeates the entire process—from data collection, to data cleaning, to data-summary (i.e., statistics) calculation and reporting. Hence, I believe that 1.) believing or mistrusting a reported statistic involves how you feel and what you think about the person or group that reported it, and that 2.) digging deeper will still involve trust, at some point, in another human being (including yourself, if you collected the data yourself).
Could you please make a series out of this?
There are a lot of additional stat. terms to be discussed/explained, which could be useful (esp. to school pupils, students etc.)
Reblogged this on Maddie She Writes and commented:
Oh what a twisted Web we weave
When we use statistics to deceive
The violence against good sense is graphic
When math’s illusions in we traffic
-Madeline Adams

Reblogged this on Raja Oktovin's Blog and commented:
This blog post is definitely a good exposition of why statistics, when understood only as function & numbers, are not reliable.
…”are not reliable.” Hmmm, some statement. Grab a stats book and look up what this word means 😉
Very nice! Thanks for this. Good start into the day.
As a visual learner (and not really any other type of learner) I appreciate the colorful breakdown! If you could re-teach me everything I’ve forgotten about statistics that would be awesome, thanks.
Made me revise my statistics in a funky way, thank you !
Reblogged this on Pi UnSquared.
Reblogged this on Statistics and Substance use and commented:
Wonderfully simple depiction of why you should take a lot of statistics with a pinch of salt. You need to look deeper and explore the underlying distribution.
in short: “You can do anything to say to the numbers, even the truth”
Goes with “Figures don’t lie, but liars can figure.”
Outlaw MJ because 90% of heroin addicts started with MJ.
Which begs the question “Why not outlaw milk, because I’m pretty sure 99% of heroin addicts started with milk.”
I know this “milk” example since my childhood (in Germany) which is a couple of decades back in time.
Lol
Just finding ways to paint Statistics black!!
Well, the facts are from reliable figures anytime.
Only grump it missing standard deviation but I am so using this in my mathematics class
the “variance” cartoon applies just as well to standard-deviation. great post here, MWBD.
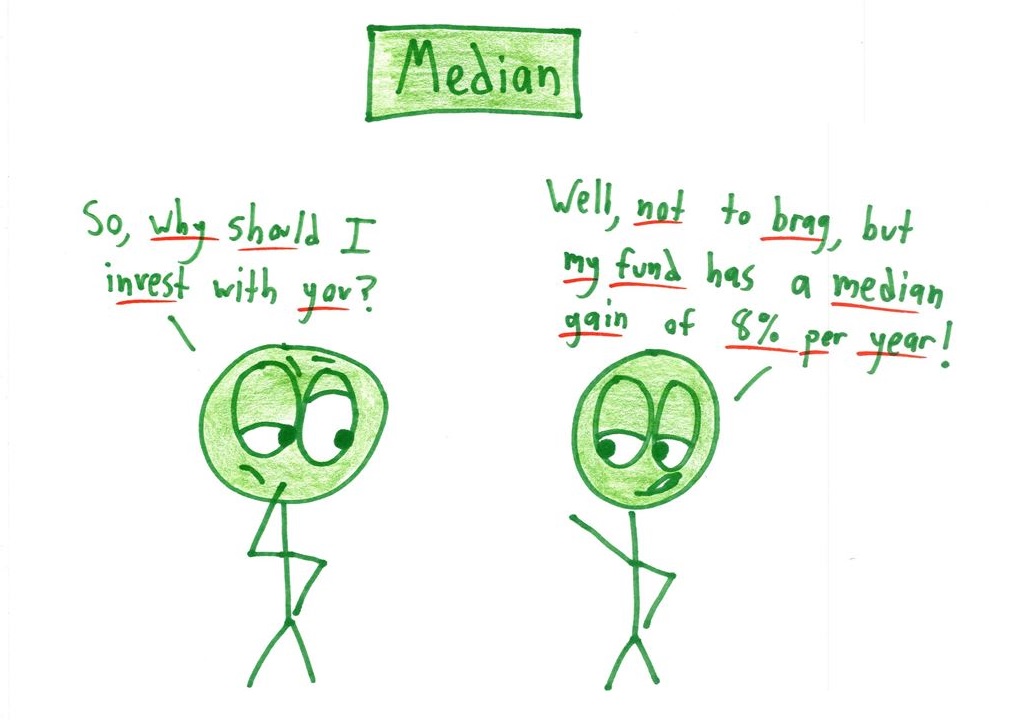
Isn’t the cartoon for the median wrong?
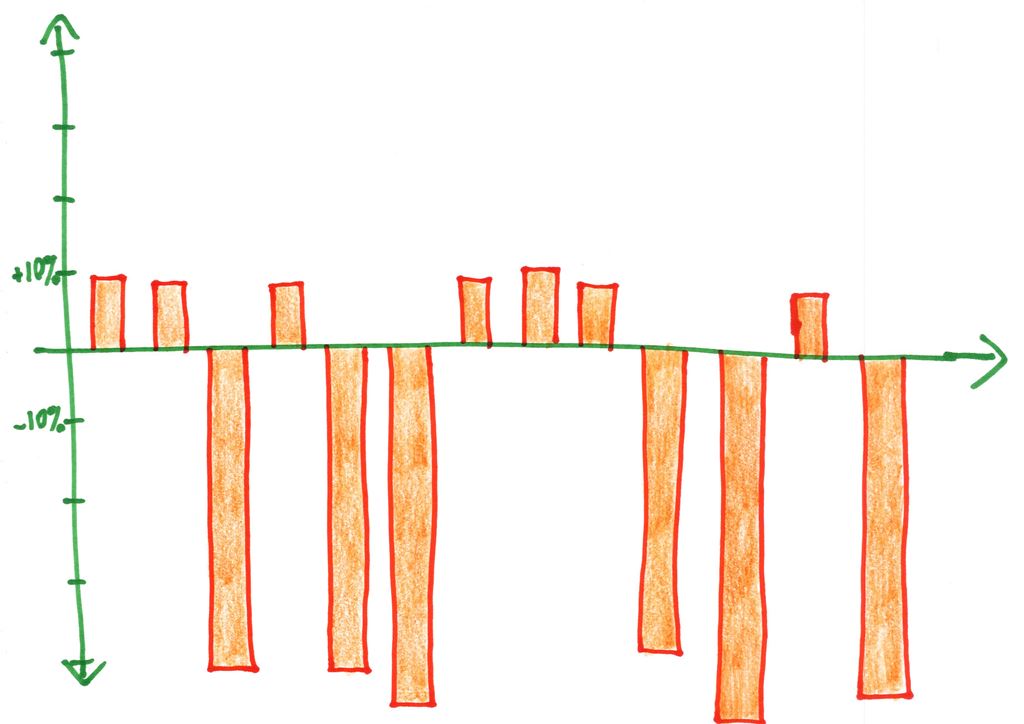
The median is the point where half the data is above it, and half the data is below it. So in this case, there are 6 data points (way) below 0 and 7 data points (slightly) above 0. The smallest of the positive data points is the median, since 6 points would be above it, and 6 points would be below it.
If there were an even number of points, the convention is to use the midpoint between the two closest numbers. (So if you had 6 points above and 6 points below, you’d take the average of the lowest number above 0 and the highest number below 0).
Great post – learning statistics has been extremely useful in deciphering how so many true statistical statements completely hide the truth.
To get median, I’d count the number of numbers, add 1, then divide by 2.
Median values is not only the “middle” one in the set. The set itself has to be arranged from lowest to highest values. So yeas, the pic for the median is wrong.
It’s not wrong though.
It’s in chronological order instead of in order of lowest value to highest, which is how you’d expect the gains from a mutual fund to be charted.
@BlackBloc If the list is in chronological order, then only median value you could get would be the median date, not the median gain.
The picture isn’t wrong, but the statement doesn’t appear to be correct. The median value, once the values are arranged in order from lowest to highest, looks like a 10% gain; not 8%. The 8th data point (not rearranged) along the x-axis is the value associated with the median value in this data array; and it looks like it exceeds 10%. Long story short, the wrong answer is given in the illustration.
These are great! Did you draw them yourself? Wow!!!
You can make numbers look good or bad depending on which way you wish to swing your opponent.
Statistics are like bikinis… they show a lot, hiding the essential.
excellent !!!!
I have to reblog and share to my fellow staticians.
Reblogged this on Nderi Sarah and commented:
Statistics: There are three kinds of lies, lies,damnes lies and statistics.
Statistics (and “fellow staticians” (sp)) don’t lie; but ignorant consumers of statistical information can easily have the wool pulled over their eyes.
Yes, that is true as happens in Kenya, where politicians use the same data and analytical methods but come up with different outcomes hence damned lies.
A statistician drowned wading a river with an average depth of two feet.
I worry that a headline like “Why Not to Trust Statistics” coupled with a “statistical liar” avatar in each illustration panel may unfairly encourage the reading of the message as “Why Not to Trust Statisticians”—who are in theory (pun intended) exactly the scientific professionals best trained to identify the sorts of untrustworthy statistics that motivate the headline. I would probably have had a concluding panel with an avatar helpfully suggesting, “Ask a statistician!”, so readers would know where to go. But otherwise, this post does a nicely intuitive job of (literally) illustrating why and how to be careful of reported statistics.
So agree with this! Increasingly pissed off with the “lies, damned lies, and statistics” line. Easy line for students that don’t like stats to motivate why they don’t need to like stats.
Statistics are like a bikini: Shows everything, but hides the essential!
Hello, I love Your work, drawings. I love, also, math.
Would you be ok with me printing this out for my classroom wall?
Go for it!
Thank you! It can join the army of XKCD and occasional others :).
We added this to PS101.com for 6th graders first learning about stats as well as for even more advanced high-schoolers. http://www.ps101.com/lesson/57877ca065a8fc0300c1fe67
Reblogged this on Neurotic Knight.
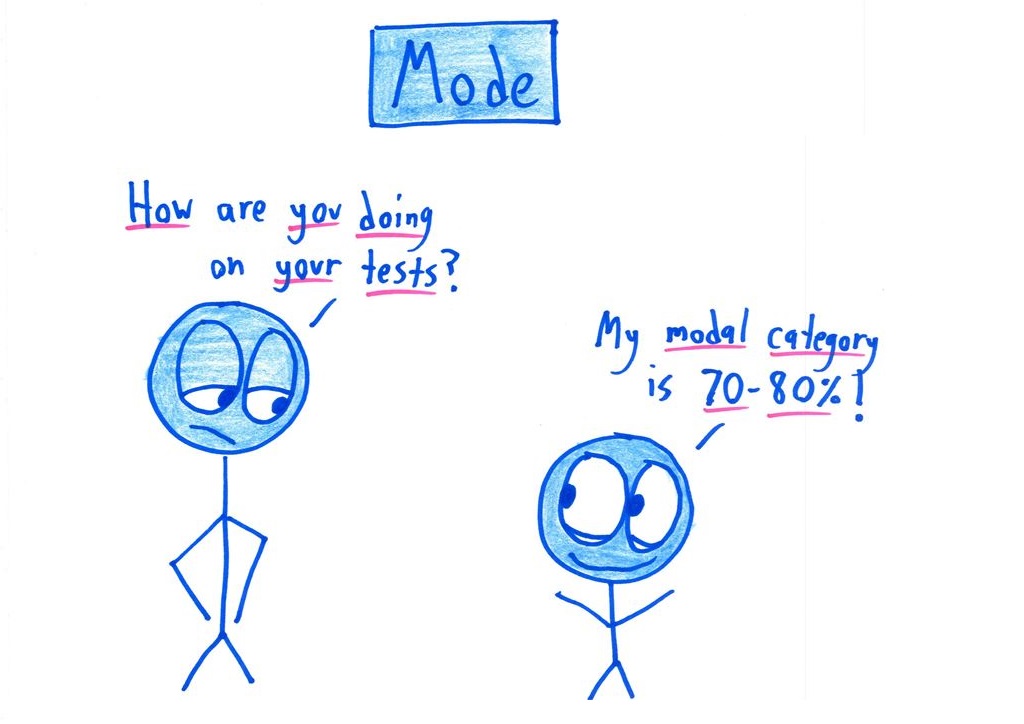
I am disappointed by your title since you are spreading a distrust of a method of reasoning and not the interpretation itself. You should be teaching that statistics is the collection of data points for interpretation and not proof of some concept or idea. The mean, the mode, and the median are descriptions of the collection of data points and nothing more. How often do individuals and groups use averages as proof of some theory or idea and yet very few people actually challenge the “numbers” as descriptions of the data and conclusive proof of anything. The funny thing is that statistics don’t lie, people do. Yet to continue sowing mistrust of numbers rather that exposing misinterpretations is an outrage. Even regression is a method of inference since we are examining how well the data points regress or come close to the mean. A collection of data points is meaningless until we seek to infer a pattern through analysis. This is what you should be teaching your students. And that to infer is not to prove an absolute. We seek to infer from a population what particular data points of a particular behavior have a general pattern, not that all data point behaviors are exactly the same. If all data points were exactly the same then we would need no analysis. But in real life, we never have such a luxury. We must use inference instead.
This would be better titled “why you should learn basic statistics.”
Statistics don’t lie, statistics are numbers and numbers never lie. PEOPLE are the ones who lie. And those people can only lie when their audience doesn’t know heads or tails about this stuff. With a basic knowledge of statistics, when someone says “the average for the whole company is $30,000” you’ll be smart enough to say “and how does that compare to the company wide median?” When someone says “my median is 8% gains” you’ll be smart enough to go “and what’s the average?”
Of course there are other important questions you’ll learn to ask as well: “How large is the sample size?” “How was the sample taken?” “What purposeful or accidental biases exist in the sampling process?”
I hate it when people say “statistics lie” because it’s patently false; *statisticians* with agendas lie. Hard statistics, properly measured, are the only way we can figure out a lot of cultural trends: is there a wage gap? Are police more violent towards black people? Is the US infrastructure starting to fail? Does human-caused global warming exist? Is this drug causing negative side effects? Is this drug more useful than a placebo? Do vaccines cause autism?
We need statistics and the public can’t go around thinking “statistics lie.” The public needs a better understanding than that. They need to be thinking “statistics can be manipulated by those with agendas, is the statistic I’m looking at now one such statistic?”
The more you know, the harder it is to lie to you about things. Remember that. You can’t dismiss a statistic out of hand because “I read statistics lie,” but neither can you immediately accept it because statistics can be manipulated. Statistics is a rock solid branch of mathematics and, if executed in an unbiased manner, it will always give you a correct answer inside whatever error bounds you choose.
I agree with so much of this.
I’d only add that “statisticians” here refers to a larger group of people than just “professional statisticians”. I’m a biostatistician, for example, and there are professionals like me called statisticians; both of us are trained in statistics, and are professional statisticians. On the other hand, many other professionals who use statistics (e.g., in business, finance, economics, sociology, psychology, medicine, computer science, data science) haven’t necessarily been trained with as much rigor as we have in statistical principles. Hence, they aren’t professional statisticians, but rather professionals who use statistics. And then, there are non-professionals who are even less trained in statistics, who nonetheless will use them.
So I’d say that “*statisticians* with agendas lie” really means “*people who use statistics* make mistakes, and having an agenda can even encourage such people to lie using statistics.”
I’ll emphasize that many non-statistician professionals may certainly qualify as professional statisticians over time, and may eventually surpass an average professional statistician in her/his knowledge of statistical principles. A non-statistician professional may even start out more qualified in statistical principles than an average professional statistician; there are definitely many that have.
My point is that in general, a professional statistician has had more training in statistical principles compared to a non-statistician professional, and so in theory is best-poised for consultation about possible statistical deception. Of course, that also means professional statisticians in general have the added responsibility to call out misleading statistical reporting done by people who report statistics (e.g., see list above), and an added responsibility to improve statistical education and literacy.
Sure, I’ll happily agree with that. We can say that “statisticians” refers to a larger set of people. A lot of times the people aren’t statisticians or even “professionals who use statistics”, as you say, they are just reporters or pundits or politicians with an agenda. They will pick a single number out of a larger study and spit it back out because it “supports” their narrative, even though it really is a worthless number. And yes, I’ll agree that sometimes it is just purely a mistake which results in statistics being misrepresented; but I feel like more often then not in the daily life of “average people” who don’t work with numbers all day most of the statistics they see are not “by accident.” They are set out there with a goal in mind; see Fox News and/or MSNBC. the two far sides of the coin.
Take the 27cent wage gap stat, for instance, which is grossly misrepresented on a regular basis in the media. It was taken a straight average income of all men vs the average income of all women. It didn’t account for profession, level of education, or hours worked even. That number was cherry-picked out of the census report and repeated by less well educated women’s rights groups as a “bias in the workplace against women.” It doesn’t, of course, show that. It just shows women on average aren’t paid as much. Maybe because they only work part time more frequently, maybe because they choose different and lower paying careers, maybe because they have fewer years in the workplace because they had kids first, maybe because etc. etc. The point being the 27cent figure didn’t demonstrate anything about WHY a gap exists, just that it did, and the people claiming it was all sexism were [idiots] drawing conclusions which were not supported by the data. Of course, you probably know this, being a statistician yourself, it’s more for others who might read this to consider.
(Before someone jumps down my throat, I’m not claiming there is no sexism. I think there is a lot of sexist practices both towards men and women in our current culture; I’m just claiming the 27 cents figure is incorrect; most studies put it at less than 2 cents which is within the margin of error for those studies so they can’t even claim one exists).
I think there’s an analogy to be made with a number of other mathematical ideas–like No Free Lunch, Halting, Kolmogorov Compexity–that often have some essence of “there’s no one true method/algorithm, there are always perverse inputs”. Which doesn’t mean that we treat things like optimization, computability, and compression as untrustworthy, just that everything has their limit.
So too with data, no one parameter to rule them all (and in the darkness, bind them). Which I see you agree with in your comment.
But, what about two numbers? If you paired each location example (mean/median/mode) with a scale parameter (stdev, MAD) and vice versa, it would strike me we’d be able to catch the lie in most of the examples. Could you easily provide examples where a median and IQR leads to a big lie?
When I teach, instead of “lies, damn lies, …” I ask them to remember that figures don’t lie, but liars can figure.
Statistics don’t lie, statisticians do…
Steven, why do you think that?
Reblogged this on hughforsyth and commented:
I love this (but don’t quite understand the median one, I think it to do with dates).
Excellent! Brilliant visual to help students see the Value of knowing the theory behind the number crunching
Haha I am so happy I stumbled upon this blog!
This is so totally fresh and awesome 🙂
– The Smiling Pilgrim
https://thesmilingpilgrim.wordpress.com/
Reblogging!
The median, correlation coefficient, and variance pictures are incorrect/not realistic. To find the median of a dataset: the median is arranged in increasing order, and then you find the middle value or average of the 2 middle values (if there is an even number of data). And as for the correlation coefficient and variance, the outliers would be removed if they’re outliers that will ruin the normality of the dataset.
In addition, for the correlation coefficient experiment, the “professional athletes that they paid to guzzle the drink” would result in a pretty strong bias, which would be a red flag in the experimental design. The design of the experiment is the difference between your numbers being meaningless and not really representative of the population, or actually holding some kind of value (given that variables are controlled for). For example, you’d want your subjects to have similar activity levels, degrees of physical fitness, overall health and such, or else you’re just wasting time and money. I understand that you’re trying to make people more aware of bullshit and to think critically, but I think that this could give people the idea that the whole point of statistics is to put melted nutella on a rolled up horse turd and trick someone into eating it. It really isn’t. What we need is to teach statistical literacy, not to demonize the whole discipline.
@Greg, capital technical points, which I think emphasises the Meaning of the toons; Understanding patterns of data presents opportunities to engage with the material in the post. I think it has great pull value.
@Char, I know I’m very late to reply, but it does have a great pull value (which is why I commented on this haha), but I just think that the message is counterproductive. But in order to understand and engage the material in this post, you need to have a working knowledge of the very basic fundamentals of statistics first.
That’s how the fundamentals can be learnt. By asking the question, ‘How Is This An Issue?’ the reader engages. Assuming they follow-thru on their curiosity the wrestle begins; the game is afoot! Curiosity, reasoning, play….nNow the fundamentals have relevance and are not simply being ‘memorised’.
To paraphrase Mark Twain:
“There are lies, damned lies, and … statistics”
Thank you for adding the visuals to that quote.
* I looked it up, the quote seemingly stems from 19th century Prime Minister, Benjamin Disraeli:
https://en.wikipedia.org/wiki/Lies,_damned_lies,_and_statistics
Hi Dirk,
(The following is taken almost verbatim from my related Facebook post.)
I definitely share your desire that people think more critically. However, as a professional statistician (specifically, a biostatistician), I’ve started taking issue with that particular well-worn platitude, because I think it overreaches by casting most or all of statistics as lies—and therefore, by cognitive ease, most or all people who report statistics as liars. And despite the fact that many non-statistician professionals report statistics (e.g., in business, finance, economics, sociology, psychology, medicine, computer science, data science, biology, physics, math), my profession may receive most of the ire at misleading statistics because the word “statistics” is explicitly in our profession’s name—and is the core of all of our training. Also, the advancement of science rests on good statistical practice, and has benefited from “statistics” which, writ large, I sure hope aren’t either lies or damned lies.
To me, the statement tacitly reads, “Lies, Damned Lies, and Statistics (reported by all Statisticians)”. This may be like saying, “Wrongs, Injustices, and Laws (created by all Lawyers), or “Placebos, Quackery, and Drugs (given by all Doctors)”. (I may, however, accept, “Lies, Damned Lies, and Misleading Statistics”.)
But again, I agree with and strongly support the sentiment that reported statistics should be treated warily—not only when you are skeptical, but especially when you find yourself agreeing with them. That is, after all, good scientific practice. =)
Hope that makes sense.
I would, however, agree that the sentiment behind “Lies, Damned Lies, and Statistics” makes sense conditional on what I believe you’re expressing; i.e., “I don’t trust you, so I think pretty much anything you tell me will be a lie—including any statistics you show me.” That makes sense to me. I only hope, as you do, that people think critically enough about this statement to realize that it may not apply if you actually trust the person reporting the statistics.
Reblogged this on Outlier's Diary and commented:
It’s great really 🙂
Reblogged this on Information Hysteria.
Brilliant! Thanks a lot for making a mathematician smile.
Trust statistics, don’t trust interpretations of statistics.
mmm… the first sample is good… the avg salary is correct, the interpretation is good too.
the problem is choosing the more relevant statistics. and this statistics is related to what’s you want to see. you’ll always select the statistics which promote your idea and always find a reason to hide some other stats or data.
we can only trust raw data (with the limit of the data quality issues) everything else involves a human and “personnal” objectives, causing the issues.
There are some some good points here.
I’ll caution, however, that even raw data are collected by people; i.e., even if data collection is automated, the data-collection design and protocol was designed by people. So for me, interpretation permeates the entire process—from data collection, to data cleaning, to data-summary (i.e., statistics) calculation and reporting. Hence, I believe that 1.) believing or mistrusting a reported statistic involves how you feel and what you think about the person or group that reported it, and that 2.) digging deeper will still involve trust, at some point, in another human being (including yourself, if you collected the data yourself).
Hope that makes sense.
These are great–thanks! I would definitely show these to students.
Great!
Could you please make a series out of this?
There are a lot of additional stat. terms to be discussed/explained, which could be useful (esp. to school pupils, students etc.)
Regards
Reblogged this on Maddie She Writes and commented:
Oh what a twisted Web we weave
When we use statistics to deceive
The violence against good sense is graphic
When math’s illusions in we traffic
-Madeline Adams
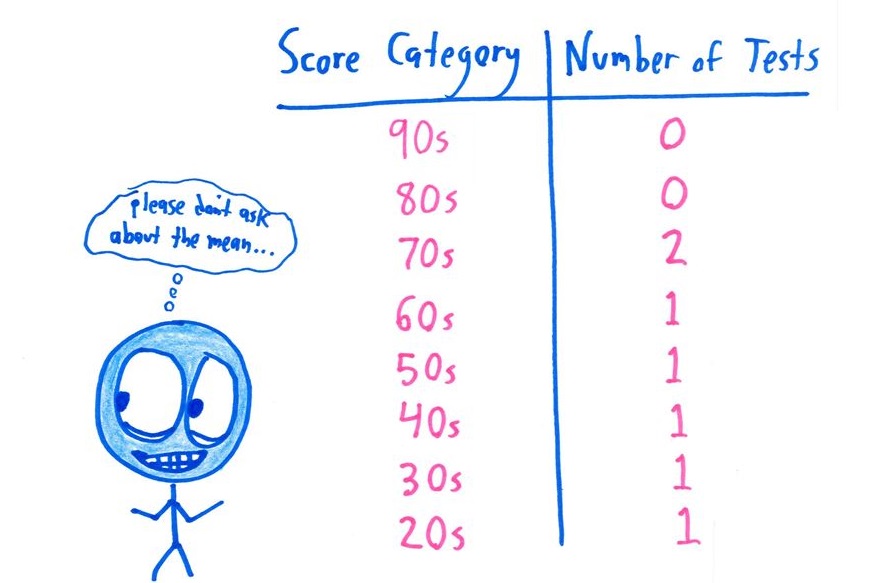
Mode is wrong? Isn’t it the value which appears most often, ie. 1 in this dataset.
esta muy buena la animacion