This is the story of a problem I couldn’t solve. It leads to a shocking, Shyamalan-style twist: I actually had solved it. It’s just that I hadn’t anticipated the nature of the solution. Compared to what I expected, the reality was both (a) less informative, and (b) vastly more interesting.
But let’s begin at the beginning.
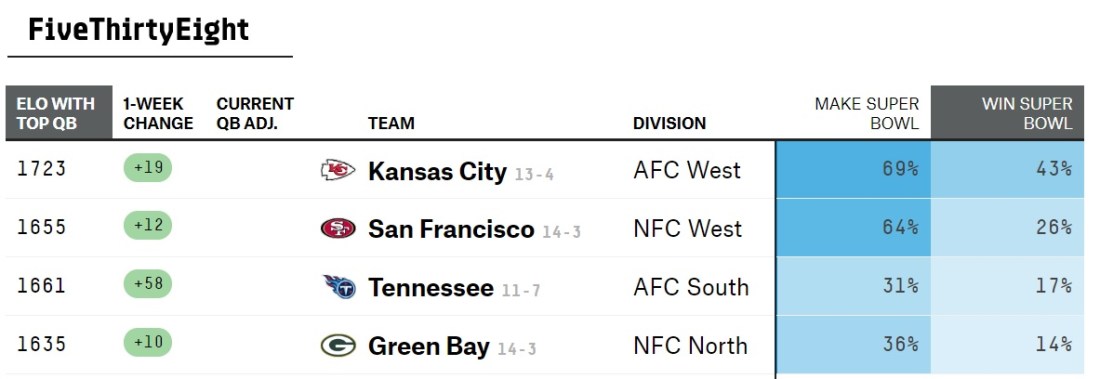
I was browsing FiveThirtyEight (one of these days, I should really go back and read One through FiveThirtySeven) when I came across a lovely probabilistic table:
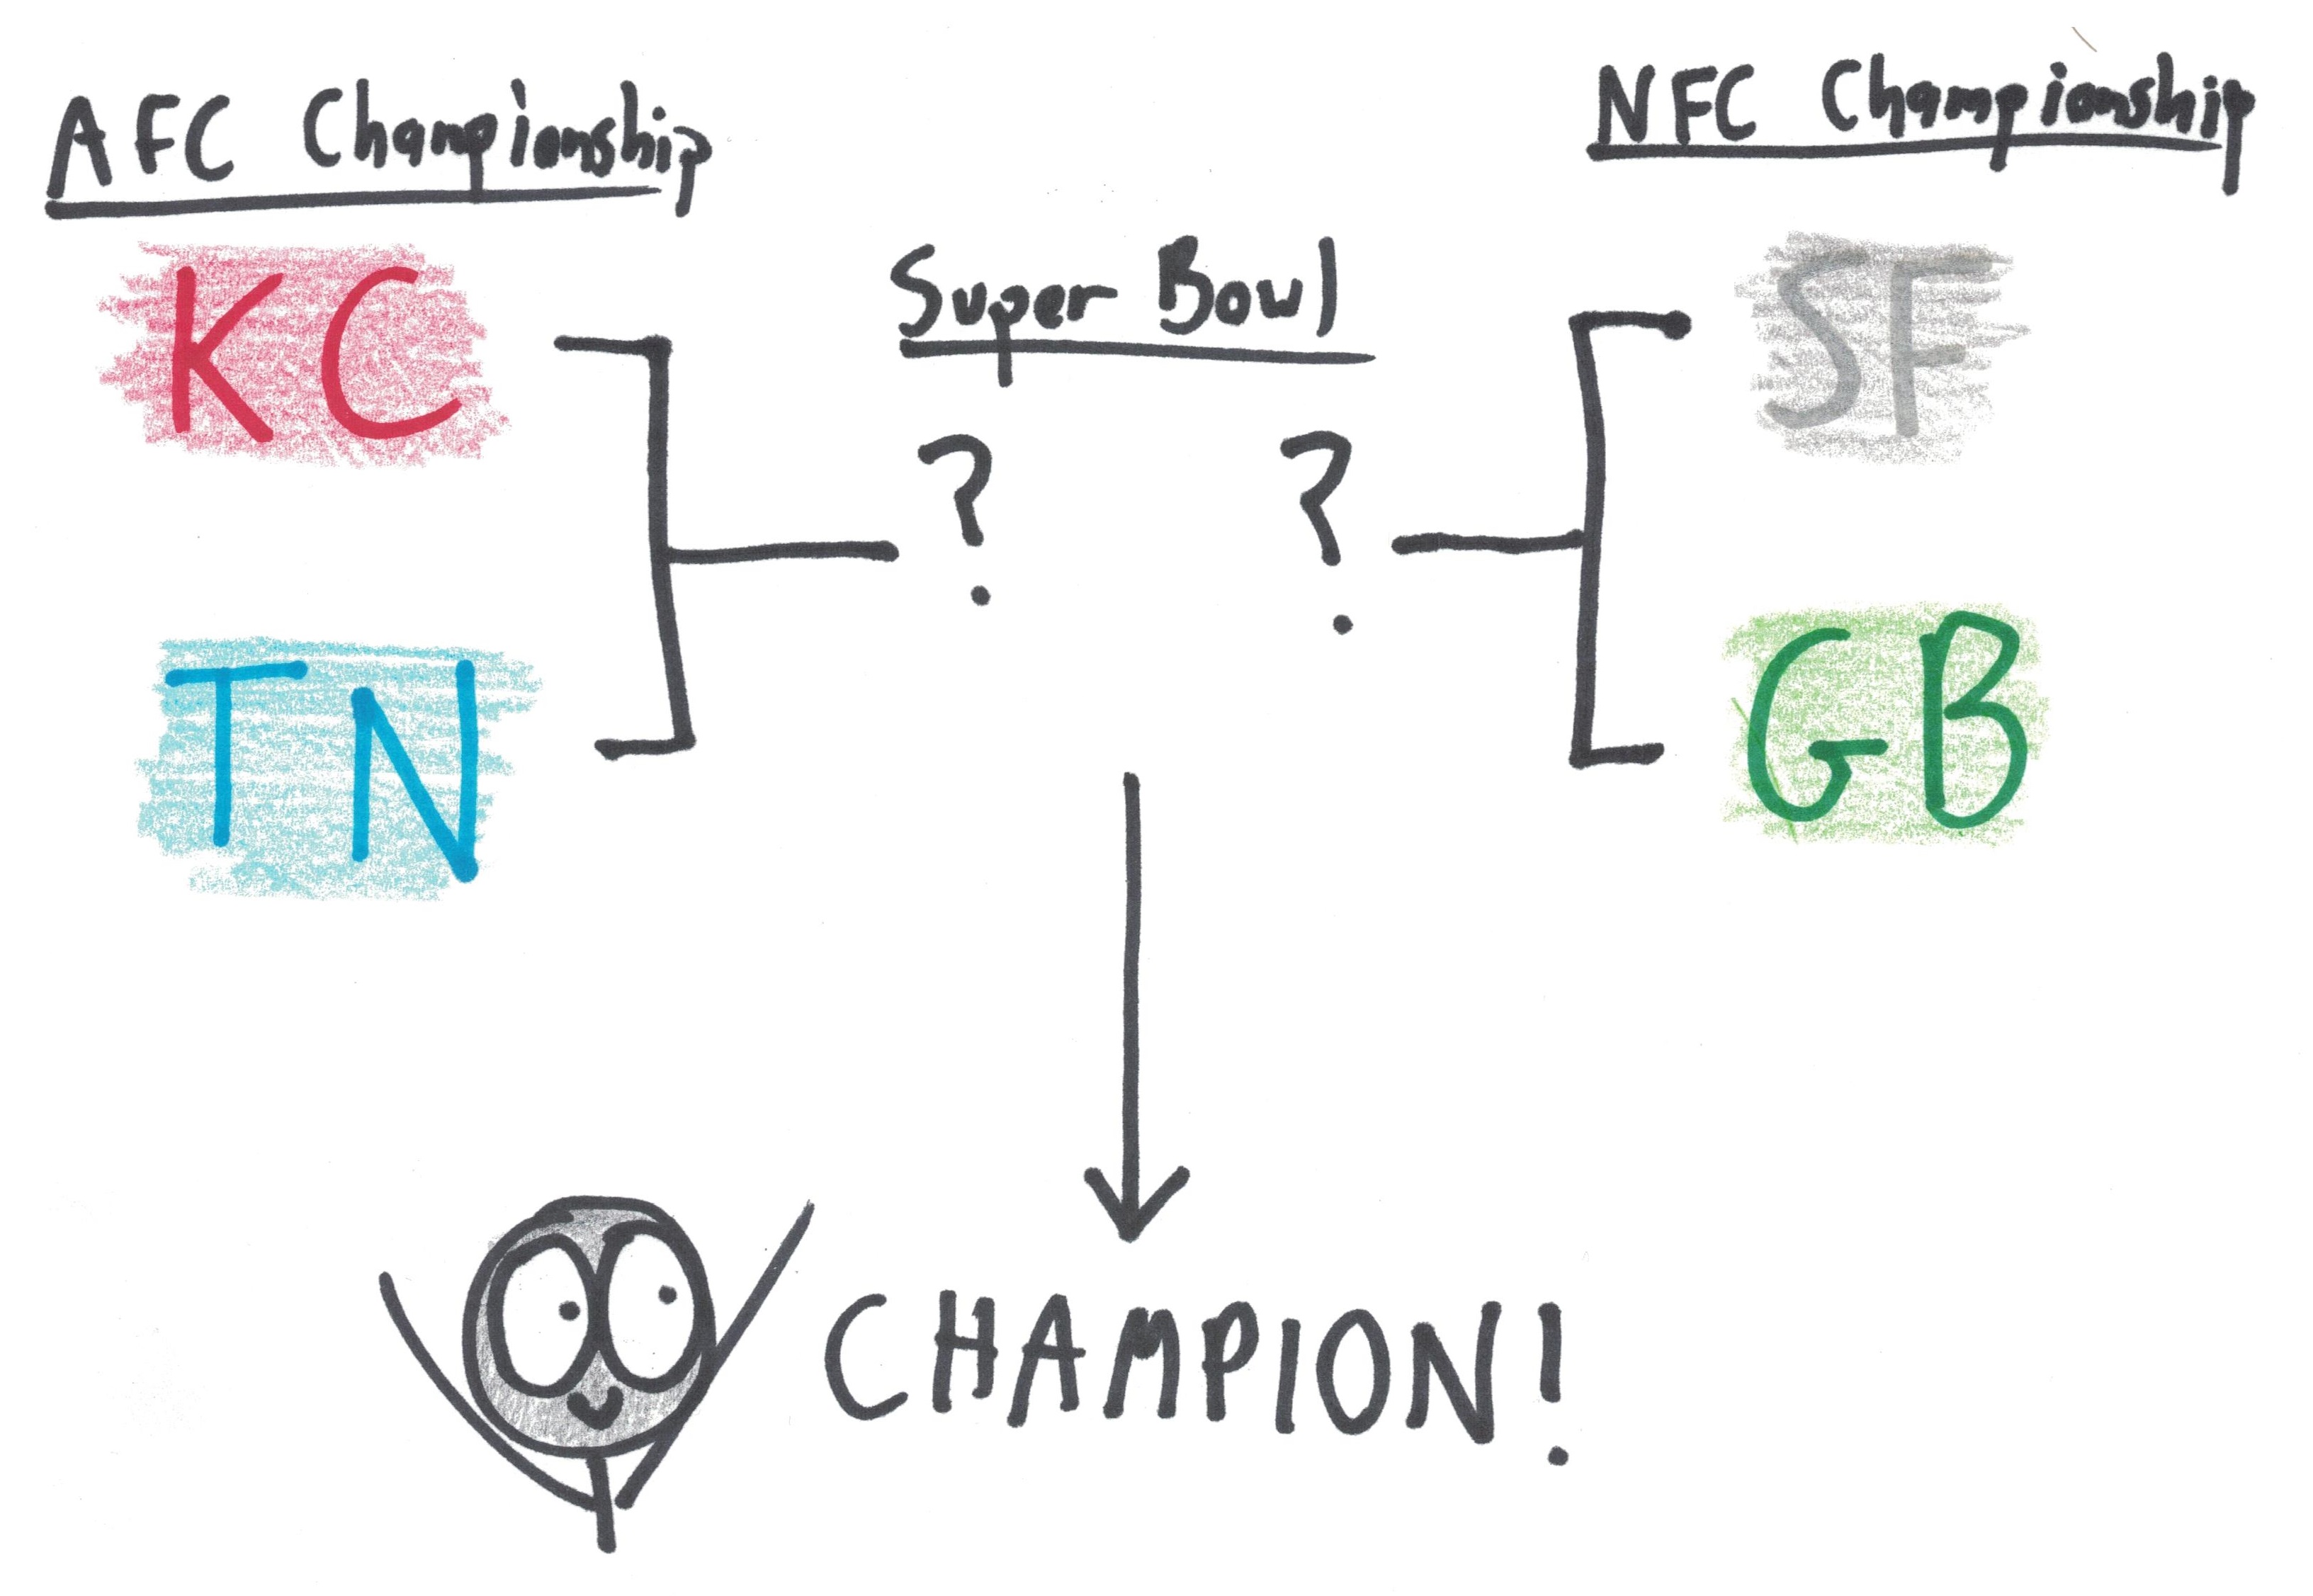
There are four teams left in contention for the Super Bowl this year. The match-ups look like this:

FiveThirtyEight uses a fancy probabilistic model to simulate these games, and then, for the plebeians like us, it reports the resulting probabilities.
From the table, it’s easy to see their odds for the coming pair of games. If the weekend were played 10,000 times:
- Kansas City would win ~6900 times, and Tennessee would win ~3100.
- San Francisco would win ~6400 times, and Green Bay would win ~3600.

So much for the AFC and NFC Championships. But what about the Super Bowl?
We can tell that Kansas City is in good shape. If we played this season 10,000 times, they’d make 6900 Super Bowls, and win 4300 of them. Thus, assuming they make the big game, they’ve got about a 62% chance of winning it.
Here’s each team’s chance of victory, conditioned on making the Super Bowl:
- Kansas City: 62%
- Tennessee: 55%
- San Francisco: 41%
- Green Bay: 39%
This was my first surprise. If San Francisco is a strong favorite to beat Green Bay, then why do they have such similar odds in the Super Bowl?
The answer, for the football fan, is obvious: cheeseheads.

No, sorry, I meant to say: match-ups.
Each team has its own idiosyncratic strengths and weaknesses (and fan headgear). That means that the odds of victory depend on who, exactly, you’re playing. Maybe A has a big advantage when playing B, but they’re equally matched against C.
That raises the question: What are the odds, according to FiveThirtyEight’s model, for each of the four possible Super Bowl match-ups?
First, I created a variable representing the AFC team’s probability of victory in each case:

Then, I converted the FiveThirtyEight numbers into equations. For example, here’s the equation for Kansas City:

And here are the analogous equations for Tennessee, San Francisco, and Green Bay. (The latter two are a little more complicated, because I defined my probabilities in terms of Kansas City and Tennessee victories.)

Beautiful. Four linear equations, four unknown variables. Not so different from the simultaneous equations I’ve been teaching my middle schoolers. And so I did exactly what I tell them to do, solving them step by painstaking step.
Ha ha, gotcha! Of course I didn’t! I plugged them into Wolfram Alpha, because I am a lazy hypocrite, and unashamed of it.

Here came my second surprise. The solution was not unique!
How does this happen? It must be that the fourth equation gives no unique information. It can be deduced directly from the other three.
“Madness!” I cried. “I must have done something wrong.”
And so I thrashed. I thought and I fought and I wrought. I looked for my error. I found it nowhere, which I was sure must constitute another error in its own right. And then I realized the truth. There was no error.
The solution really wasn’t unique.

To see why, imagine a simpler scenario. Suppose, hypothetically, that these four teams were perfectly evenly matched. Each has a 50% chance of making the Super Bowl, and a 25% chance of winning it.
From this, can we deduce the odds of each match-up?
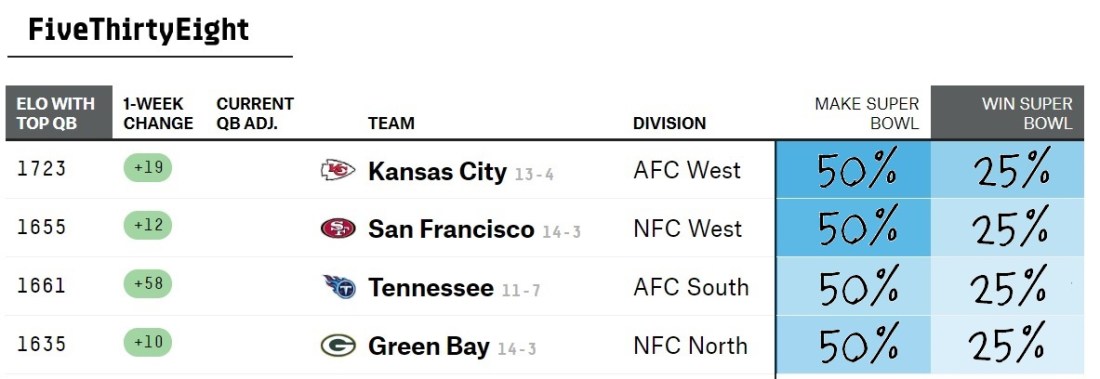
Not at all! Here are two equally valid solutions:
Solution #1: Every single match-up is an even 50/50 split. Thus, no matter who plays whom in the Super Bowl, it’s as good as a coin toss.

Solution #2: KC is guaranteed to beat SF, who is in turn guaranteed to beat Tennessee, who is guaranteed to beat Green Bay, who is guaranteed to beat KC. Thus, once the Super Bowl match-up is set, the winner is a lock.

In fact, there are infinite solutions here.
Just pick any probability p between 0% and 100%. Then, KC beats SF, and SF beats Tennessee, and Tennessee beats Green Bay, and Green Bay beats KC, all with the same probability p.
Our four equations tell us nothing about p. It could be anything!

The actual data offer a little more information than this worst-case scenario. (Thankfully, lest all my travails be for nothing!) Using the results from Wolfram, I generated this list of possible match-up probabilities in Excel:

A more interesting solution than this silly puzzle deserved, right? Two observations:
The likelier the match-up, the more information we have about it. The likeliest match-up is KC vs. SF, and for this, we know that KC’s probability of victory is somewhere between 56% and 71%. The least likely match-up, meanwhile, is GB vs. TN, and for this, we know absolutely nothing! In theory, it could be a guaranteed TN victory, a guaranteed GB victory, or anything in between.
Stepping outside the problem, some combinations of variables seem more plausible than others. The ones at the bottom and the top of the table seem incongruous. (Could Tennessee really be a huge favorite against one of the NFC teams, and a huge underdog against the other?) Meanwhile, the ones in the middle seem pretty plausible.
Now, the $1 billion question: Which solution is the likeliest?
To make my guess, I’m going to go against the whole premise of this puzzle, and argue that match-ups shouldn’t matter that much.
The original table suggests that SF is stronger than GB. So let’s eliminate any solutions where KC’s odds of victory violate this assumption. Goodbye, rows 11 and below.
Also, the original table tells us that KC is stronger than GB. So let’s eliminate any solutions where GB’s odds of victory would suggest the reverse. Farewell, rows 9 and up.
What remains? Only row 10.
That’s my final answer:

Final observation: KC and GB are not very match-up sensitive. Their odds of victory change by only a point or two, depending on the opponent.
But SF and TN are quite sensitive. Their odds of victory change by roughly 10%, depending on the opponent.
Ball’s in your court now, FiveThirtyEight. Did my laborious, low-information approach accurately recreate the probabilities?
EDIT: Looks like Peter Owen on Twitter has the solution:

My first thought was the location of the game, but as it’s in Miami this year, there wouldn’t appear to be any sort of advantage there.
Hi Ben, Loved your John Green podcast recommendation-“Anthropocene reviewed”. Let me know if you have any other such good podcast recommendations.
TIA, Vijay
On Wed, Jan 15, 2020 at 10:01 AM Math with Bad Drawings wrote:
> Ben Orlin posted: “This is the story of a problem I couldn’t solve. It > leads to a shocking, Shyamalan-style twist: I actually had solved it. It’s > just that I hadn’t anticipated the nature of the solution. Compared to what > I expected, the reality was both (a) less informativ” >