When I came across Michelle Rial’s images, I couldn’t tell if they were webcomics, infographics, or just the quirky brainchildren of a peculiar mathematical hobbyist.
Now I know: they’re all three.
Her graphs and charts routinely go viral on Instagram. Please revel in that unlikely phrase: Her graphs and charts routinely go viral. A Venn diagram on imposter syndrome has 5,000 likes. A graph about beanies has 13,000. The images are irresistibly tactile: they’re made of cheese chunks, coffee stains, dog-eared books, and plastic straws.
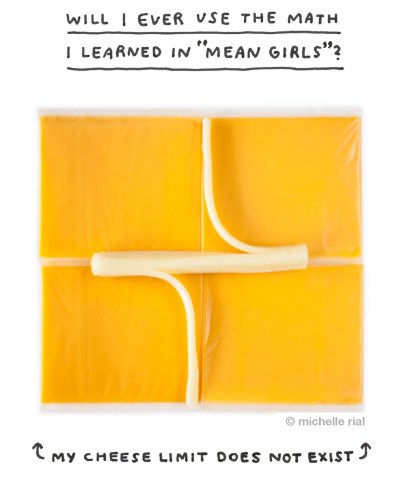
They are, for lack of a better phrase, data visualizations. It’s just that the “data” are bursts of personal insight, and the “visualizations” consist of, say, watermelon rinds. Math teachers, take note: She has turned old mathematical forms into a vivid and intimate kind of self-expression. Graphs haven’t been this cool since Mean Girls.
Speaking of which:
I myself have unbounded fondness for cheese and graphs; combine the two, and you have reached the center of a truly magical Venn diagram. I had lots of questions for Michelle about her tasty craft, which she was gracious enough to answer.
What drew you to working with mathematical visuals?
Since the day I’m writing this is five months since my dad died, I’m going to say it’s a lot of his doing. He always encouraged me to do math, gave me “summer homework,” and helped me appreciate how the beauty of the world often had a mathematical origin.
So you enjoyed math as a student?
I almost majored in math and did a sudden pivot to journalism school because of one book my roommate was reading about art direction in advertising. It had a lot of beautiful, conceptual, smart imagery. In the end, I merged both interests.
Why did you move from creating infographics to these quirky, simple graphs?
I was trying to heal from several neck and shoulder injections for some chronic repetitive strain injuries. I had also just read Elle Luna’s The Crossroads of Should and Must, and had quit my job because I felt that even though I SHOULD keep working, I MUST heal.
I was inspired by her 100 day project to just work on something simple. So I decided to make simple charts.
What inspired you to start using physical objects?
So, I’m obsessed with the Fibonacci sequence (like I said before, my dad shared a lot of these things with me when I was young, and some of them really stuck with me). One of the first things I did as I was healing was to draw easy, loose patterns around objects that I later realized had a Fibonacci element to them (pinecones, succulents).
The first chart + object was during an ant infestation. I HATE ants so I drew a scale of how much I hate ants, put the paper on the floor, let the ant crawl on it, and took a video when it was where I wanted it on the scale.
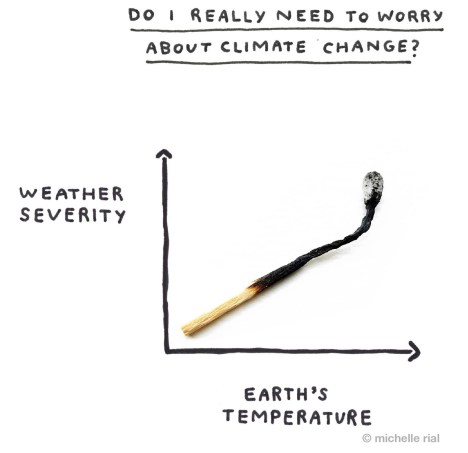
I also got really fixated on positive feedback cycles (and doom). The match/climate change chart captures that obsession a bit.
I am definitely influenced by some of my favorite artists who do beautiful, smart things with objects: Marian Bantjes, Christoph Niemann, Stephan Sagmeister.
Is making the graphs cathartic? Do they ever help you find a wiser perspective on what’s worrying you?
Yes, but not until time has passed since I’ve made it and I see it with fresh eyes. I once made a diagram to try to solve a fight with someone and it worked.
Have any graphs resonated more widely than you expected?
Yes, the “too late” one.
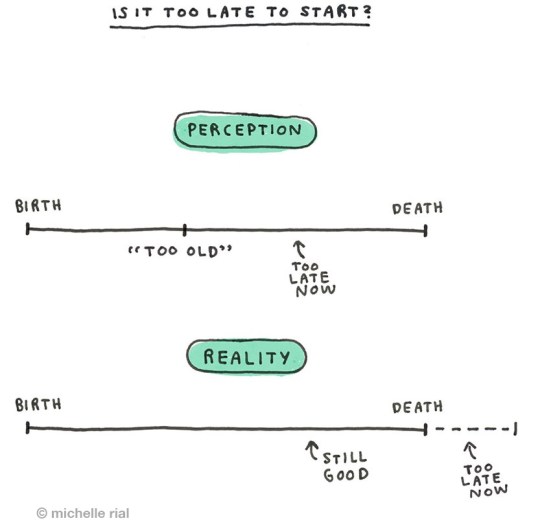
When I was sending sample images to press, I never thought to include it. It’s even relevant to me and my story, in that I started over pretty late, but I didn’t even realize it at the time.
Do you have any favorites that you feel are overlooked?
The ones I spend a lot of time on, the ones that seem most conceptual to me, are the least interesting to the majority of people. The ones that resonate most are self-help-y, but I’m most proud of the ones that are funny/smart or artistic.
What is it about graphs, charts, and diagrams that make them so suitable for capturing “overthinking”? Is it the simplicity? The complexity? Both?
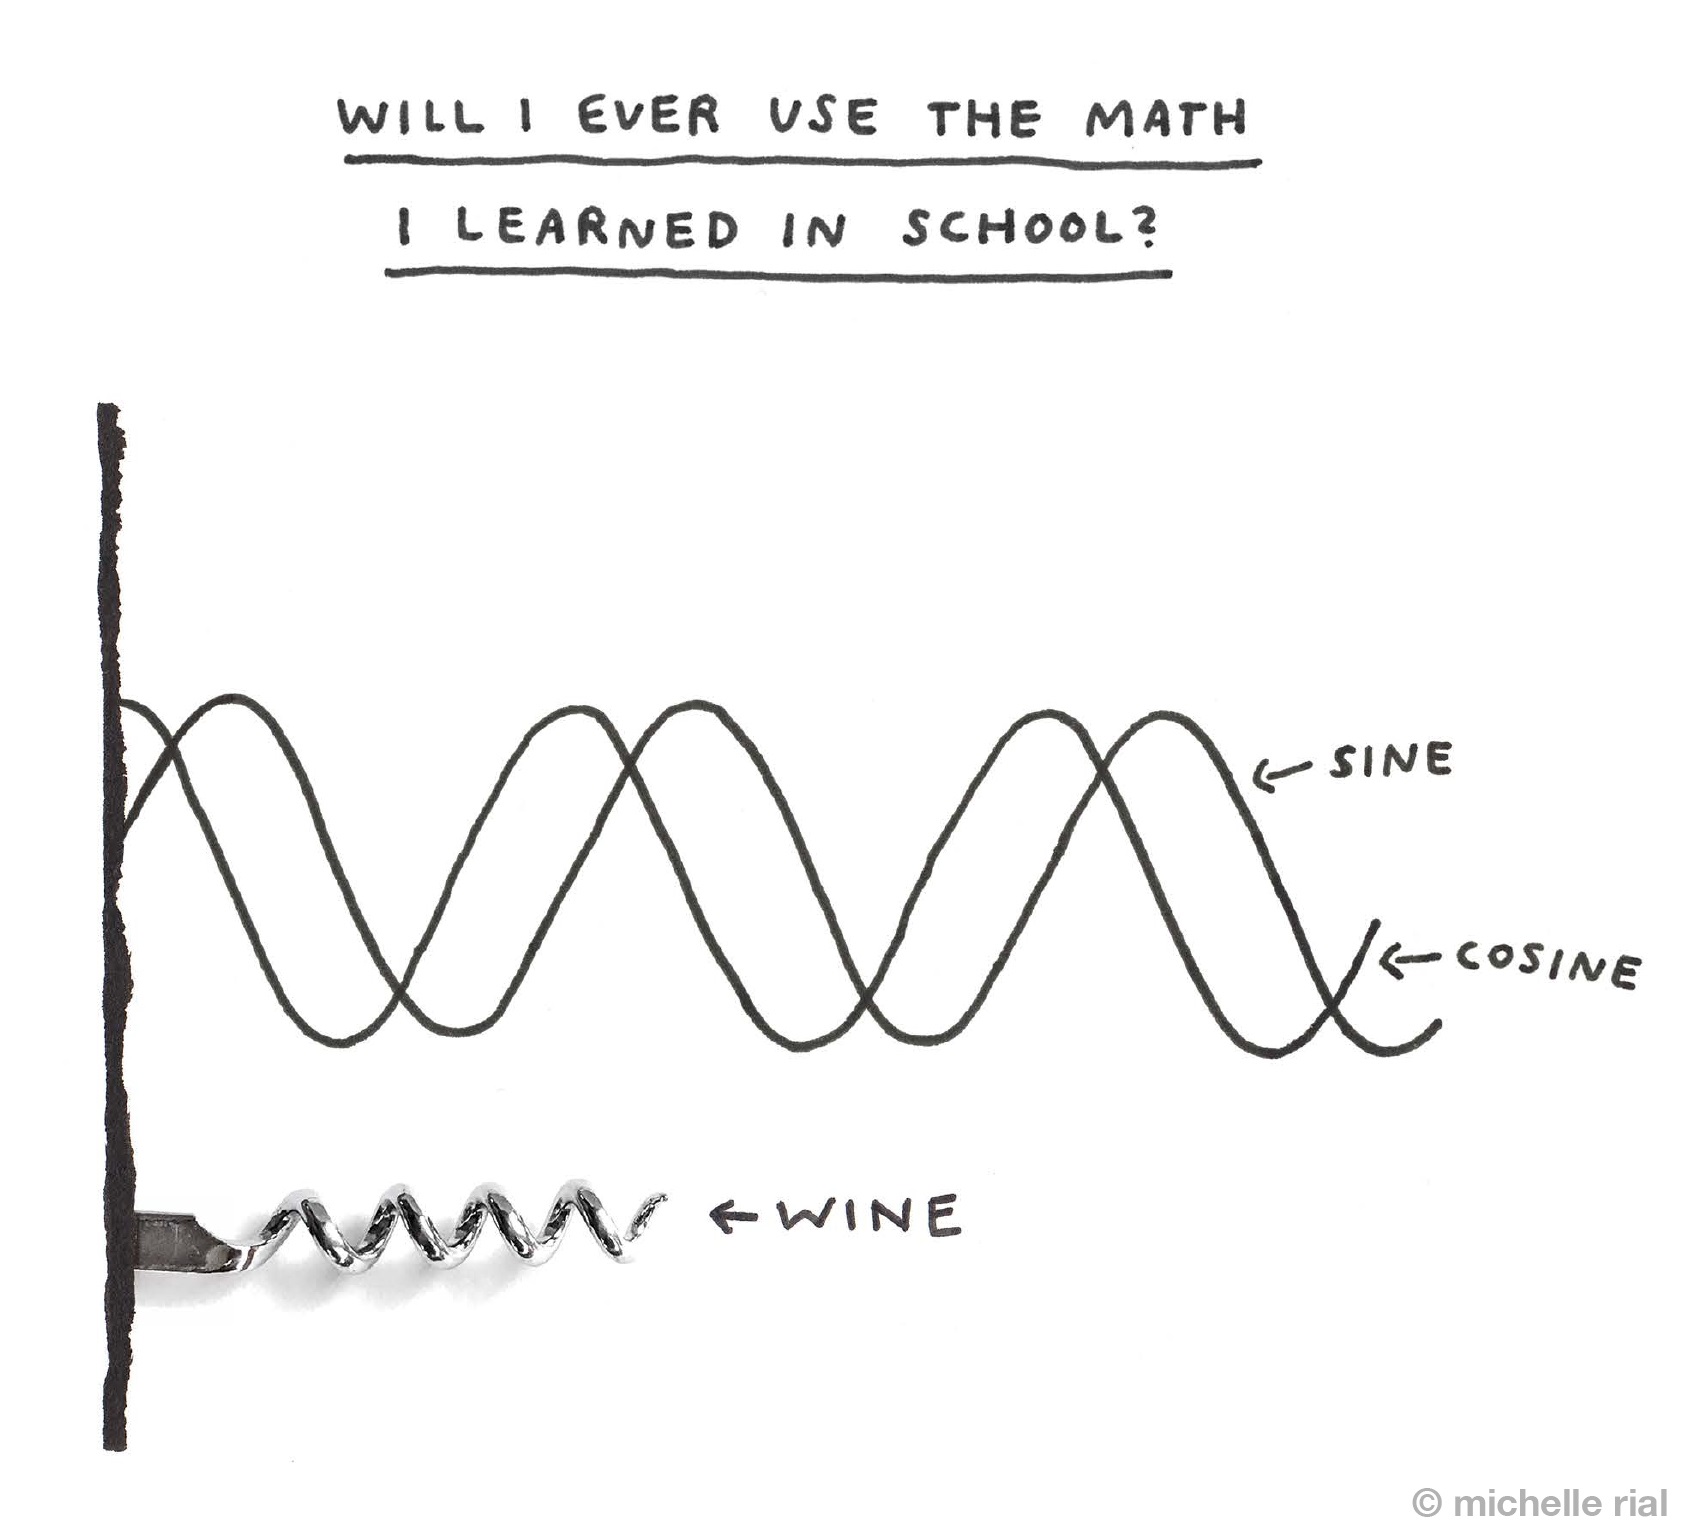
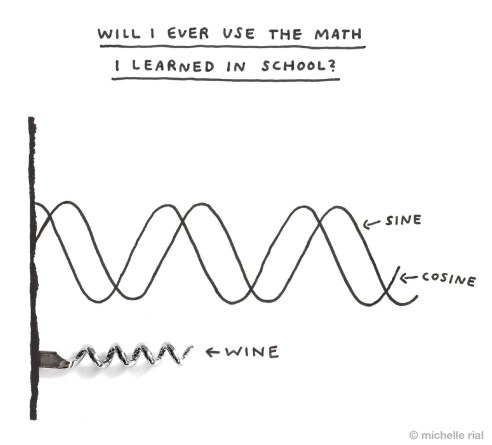
Both! They’re formulas and can be turned into life equations and they can be simple or they can go in circles or just have too much information.
I have a bit of a mental tangent problem which causes a lot of my overthinking. (Tangents = math!) Maybe this is reaching, but if you think about sin/cos/tan you’re essentially moving all over the map (visiting every possible outcome) but still going in circles (ruminating).
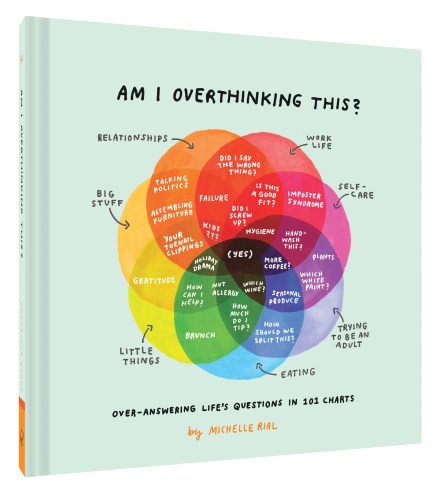
Michelle Rial’s book is Am I Overthinking This? The answer is yes, and the book is a delight.

3 thoughts on “Instagram-Ready Graphs (Made of String Cheese, Hairpins, and Burnt Matches)”